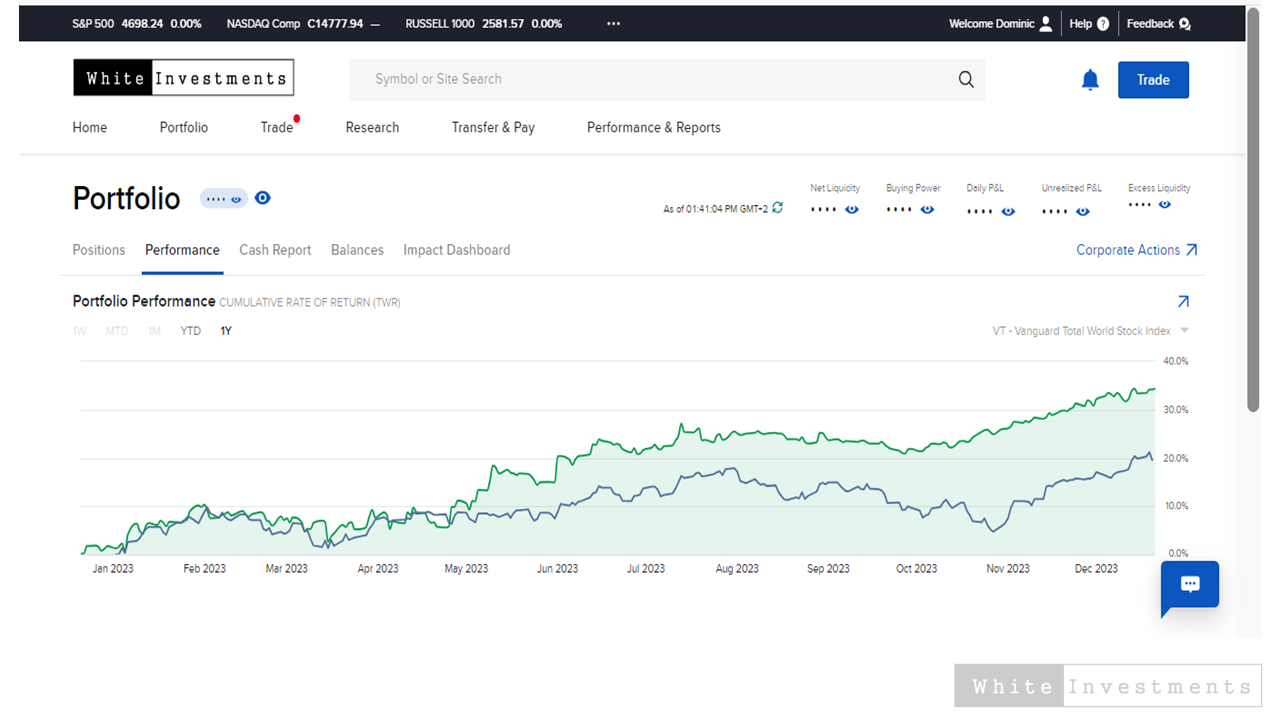
This is a screenshot showing an actual return from a portfolio I manage on my offshore platform of choice.

The GREEN line shows the portfolio performance and the BLUE line returns from a Global Stock Index. 

Looks pretty good right?

Should be used in some kind of marketing strategy right?

But do you know what it does not tell you?

  • How much risk was taken to achieve this return. And by risk I don’t mean volatility or how values fluctuated through the year. I mean the opportunity for a permanent loss of capital.
  • What was the performance of this portfolio for the 5 years before 2023? If it was -80%, then these returns are still some way off of delivering any value.
  • What was the objective of the portfolio? If this was a safe ‘I potentially need to spend the money in the next 12 months’ type portfolio, was this investment strategy appropriate?
  • How much of this persons overall wealth does this portfolio represent?  If this is their fool-around-money then it changes the perspective entirely. It is easy to take big risks and earn big returns when there is nothing really at stake. 

When you are reviewing your returns, it is important to make sure you put them in perspective.

This is not about chasing the highest returns.

You are playing your own game.

You invest with your PURPOSE in mind and measure your results on that.

Want to find out about sending money directly offshore? Let’s chat.

Read More

Cumulative Returns

It is important to understand how investment returns work in order to apply them in a meaningful way in your financial life.

Most of the time  when we hear somebody talking about long-term returns, they mean cumulative returns.

You have a starting point which you adjust each year by the total return (price + income) for a number of decades.

Just about every equity index over a 50 year time horizon is going to look pretty impressive on this basis.

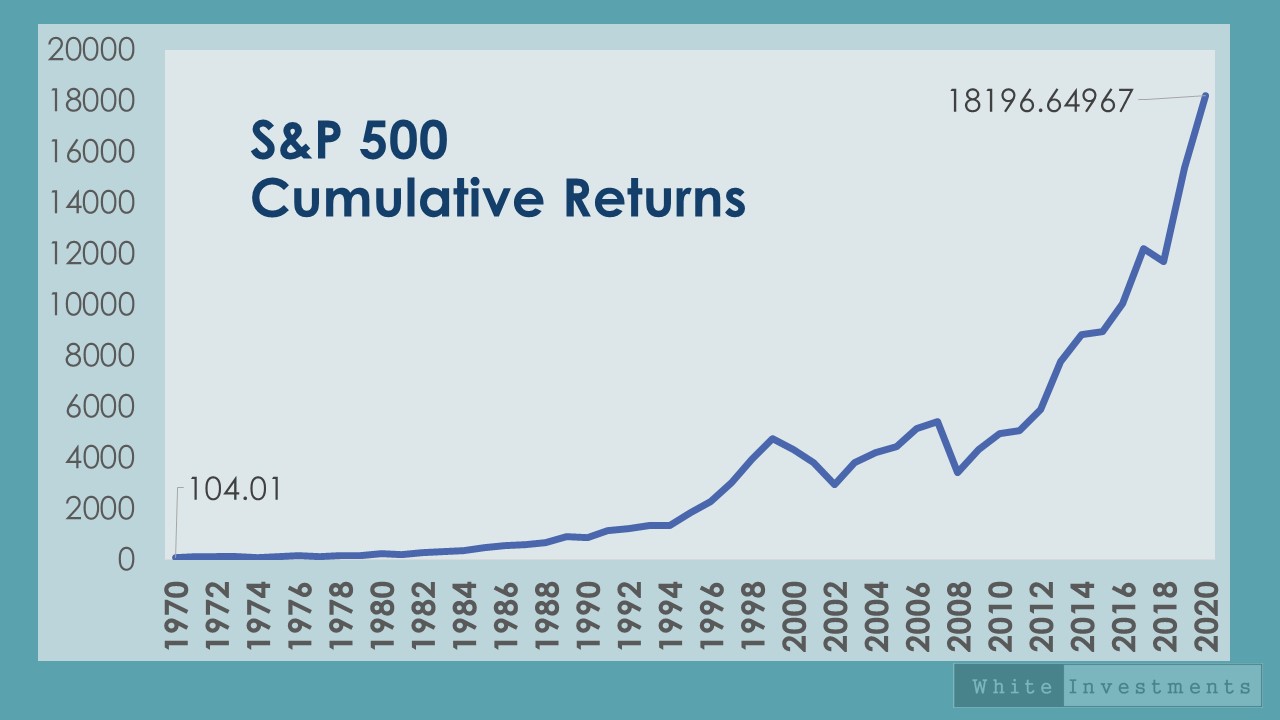
Exhibit A: S&P 500 total cumulative returns in the graphic ABOVE. Turning $100 invested into $18,000 over the 50 year period. 

Who does not want a piece of that?

Cumulative returns are the main reason people repeat very sagely, ‘It is not about timing the market but time in the market’.

But in the real world many of the goals and objectives we are planning towards do not have the luxury of a 50 year time horizon.

Shorter-term objectives should be seen in context

Maybe you are five years away from retirement. Or your child’s education costs you have been saving for from birth, are kicking in a couple of years from now.

When you stop working you will typically begin consuming your wealth and this too is made up of multiple shorter time periods. You will need to cover cost outflows each year into perpetuity.

In this context it would perhaps be more helpful to  to consider the returns we are likely to receive over shorter time periods – Let’s say 5 years.  If we look at returns over the last five years but on a continuous basis – we call this rolling 5 year returns. (The dark blue line in the graphic ABOVE). Each data point shows you what your annual returns would have been if you had invested 5 years before hand.

As you will note from the graph, it becomes less obvious that just buying an equity index will actually do the best job for you. There are quite clearly a few five-year-periods where nothing much happens. Then there are those where very large returns are enjoyed and inevitably periods where for five years running you lose money.

Why this matters to your financial plan

In planning we often use the average of the cumulative experience (the red line in the graphic) to provide a ‘decent’ indication of expected returns. But this approach knowingly fails to capture  the current valuations (expensive or cheap by price-to-earnings for example) and therefore the future expected returns.

And as the graphic below shows, even in a developed market like the US you can go for extended periods without earning any returns at all from shares. This is the S&P 500 index from 1998 (pre-dot.com to well after the Global Financial Crisis (2013)).


How you can improve your odds of success 

– You will probably receive returns way above and below the average. You can receive negative returns over a 5 and 10 year period.
– The biggest determinant of future returns is the price you pay for an asset.
– Periods of above average returns are, more often than not, followed by periods of below average returns.
– Extrapolating the most recent excellent 5 year performance of an asset class is almost always wrong for the next 5 year period.
– Paying attention to your cashflows and the timing of those cashflows is very important to your ultimate success.  
– Timing the market may be a  fool’s errand, but buying regardless of valuations is similarly futile.
– Not aiming to pick the best performing asset class year in and year out is a sensible strategy.
– Seeking better consistent long-term average returns will work better when targeting specific objectives.
– Returns should always be evaluated in context of the risk you must take to achieve them.

Read More

Avoiding the sales pitch in financial services is sadly a skill you need to develop.

I recently consulted with someone who had been shown a table of fund returns from a product house.

The return number being dangled as the proverbial carrot was an impressive 50% gain in the last year. The message being conveyed was ” This is what we can do for you if you move to our fund.”

Who wouldn’t be interested in a 50% return in one year let’s be honest. I often speak in our workshops about how the world of money management is made up of half truths. This is a great opportunity to illustrate the point. 

How the story is told:

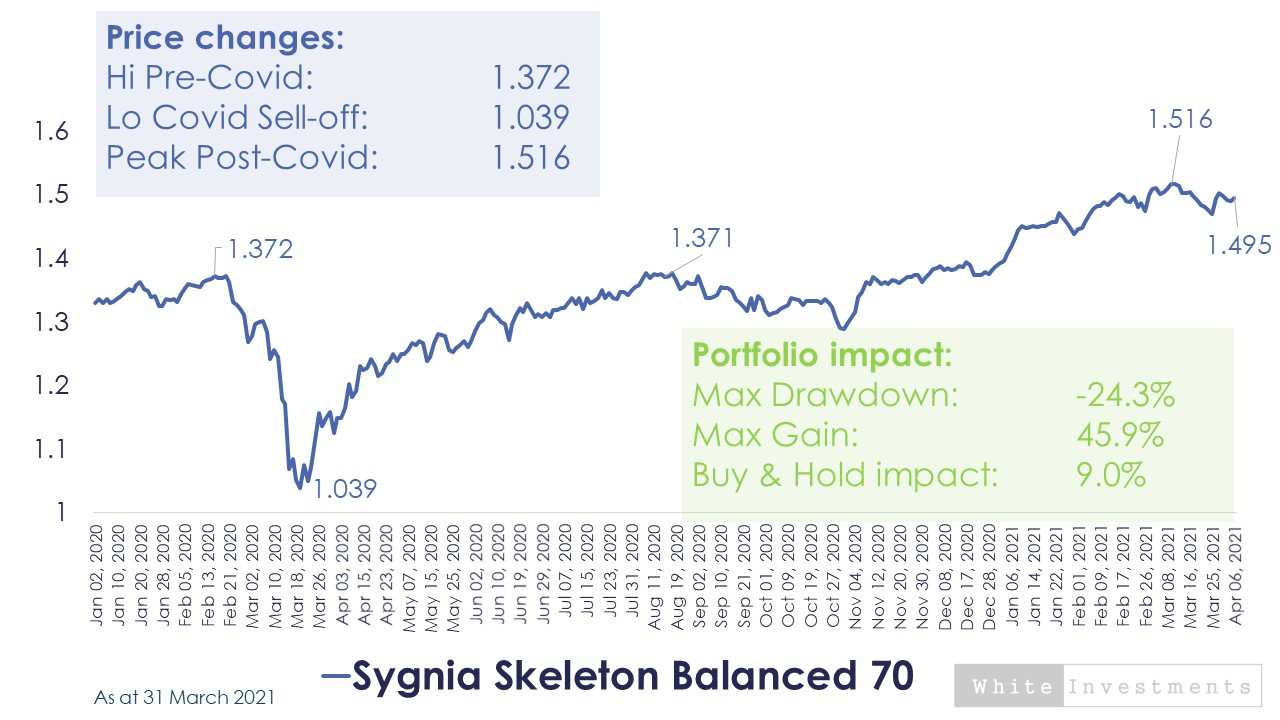
The graph above shows how the unit price of  the Sygnia Skeleton Balanced 70 Fund* changed over a period of time. 

The big dip down is March – April 2020, when the pandemic resulted in a global shutdown. If this was your only holding, your portfolio would lose a quarter of its value in a matter of weeks. 

The recovery from that low to the new peak recently, represents a gain of 44%. Conveniently close to the carrot return being dangled in my example above. 

What the reality is:

However, if you held the fund before the sell-off and continued to hold it today, the actual return you have experienced is closer to 9%. 

So while the return being used to try and make a sale above, was an actual return, it is very clearly also only a half truth at best. This is the marketing or product sales pitch.

But remember the gains you need to make in order to get back to your original position following a loss looks like this: 

The  Sygnia fund above would have returned 33% from its low to get back to its pre-covid 19 sell off level. (Which you remember was a 25% decline). 

Similarly a 50% loss requires a 100% gain just to get you back to where you were before hand. 

It may be analysis worth doing (another time) but I’d bet some of the biggest losers last year, are now showing the best gains in the fund peergroup simply as a result of the above. It does not mean their long-term owners are any better off however. 

How to combat the sales pitch:

You should always steer clear of short-termism or placing too big an emphasis on 12 month numbers. A better indication would be to  increase the measurement to 3-years at least, 5-years or longer if possible. This is really what is going to help you generate wealth, not picking the highest return in any given year. 

* The Sygnia Skeleton Balanced 70 Fund is a balanced fund in the ASISA  SA Multi-asset High Equity sector. Yes I know that just sounds like gibberish. It just means it represents the type of fund that 95% of South Africans hold in their retirement portfolios.

Read More

    
Whether you know it or not, if you have a proper investment plan in place you have made (or hired someone else to make on your behalf) some rather large assumptions about the future.

One of the first steps towards saving and investing for a future goal is to have an idea of what that future goal will cost at the point in time when we need to pay for it. From this point we can determine:

– how much we will need to contribute,

– how much we will need to earn (investment returns) on our contributions

– and what type of investments we will need to purchase to give us the best chance of achieving our goals.

In financial parlance we get to the answers to all of these questions through a process called financial modelling – A financial model is a tool designed to help quantify future goals and better quantify what we need to do to get there. A financial model will also provide a framework against which we can measure our progress over time.

Since no one has the ability to accurately predict the future we have to make some assumptions or educated guesses about certain future outcomes that go into the model.

Herein lies the greatest risk and weakness of a financial model – You can get it to tell you pretty much anything  you want to hear based on the assumptions that you choose to use.

The quality of the inputs directly correlate to the quality of the outputs – In other words what you put in is what you get out so it’s a good idea not to use rubbish assumptions.

Whether you use a financial advisor, a robo-advisor or have gone the full DIY route you should be aware of and understand what assumptions your plan is using when projecting your future financial outcomes.

A more sound knowledge of these factors should allow you to create plans with outcomes which are likely to be more accurate and therefore beneficial to you long-term. You should also be in a position to identify when sales people are merely using pie in the sky assumptions to flog more product.

With a few working examples we hope to shed some light on two of the more common areas of modelling risk that are likely to impact on your investment plan.

In our working example let’s assume my goal is to pay for my 8-month old son’s high school education. I would like him to attend a reputable non-private boarding school  – The 2016 fees for this institution (tuition & boarding) is R95,000 per year for Grade 8-12.

What I really want to know is what I need to be putting away monthly now in order to have the full fees available by the time he starts his Grade 8 year, which incidentally will be the year he turns 14 (2030).

The two most important assumptions I have to make involve:

(i) Inflation

(ii) Investment Returns

Inflation – I need to know at what pace the 2016 fee likely to increase over the next 14 years?

Of course inflation is not something that is in my control – The school will set their own fee adjustments annually and can range anywhere from 7.5% up to 12% in my experience.

Inflation increases costs at a compound rate so I have got to understand that over a 14 year period seemingly small differences in percentage terms can actually have a massive impact on the quantum of my end goal.

So if I assume an increase of 6% then my Grade 8 cost in 2030 is about R215,000 or a total high school cost of R1,211,000.

But if in reality the cost of my chosen school rises by 9% per year then the Grade 8 cost will in fact be R317,500. The total high school cost at this rate would be R1,900,000.

Feeding that through to my original question of how much I must be putting away monthly to get to my target it becomes clear if I use 6% in my financial model, I will need to put away about R2,700 per month. But if I used a more realistic 9% increase, I will need to put away R4,200 per month (Both assume a 12.5% annual average return).

Using a 6% increase is therefore more manageable monthly but I will be about R700,000 short of the real target if I follow through with this assumption.

Investment Returns – What pace can I reasonably expect my savings to grow at over the next 14 years?

The rate of return that I assume I will receive on my invested contributions will similarly impact on the amount I need to be putting away.

The investment return assumption I input into my model must crucially be on an after fee basis to reflect a more genuine actual rate of compounding. For example, if equity markets are expected to deliver 14% per year then each percentage point of fees that I pay to various parties will serve to reduce my actual returns and therefore increase the amount I will need to contribute on a monthly basis. 1

The actual returns I receive will depend on market conditions and the mix of assets that I use with my portfolio or my asset allocation.

For the purposes of this illustration I will use three levels of returns, which will somewhat clumsily fit into the definition of low, medium and high risk as per the conventional naming methodology. 2

So for the low risk option let us assume a pure cash play with a return of 7%.

For a medium risk portfolio  we will use the average return of the medium equity fund group over 15 years, which as at end of March 2016 was 14.0%.

For high risk we’ll use the average return of the FTSE JSE All Share index over 15 years less 0.5% which is around 16%.

At each level of assumed returns my required contribution amounts look like this:


What is evident is that safety and consistency of returns comes at a price.

– If you want to invest in a low risk fixed return portfolio you will simply have to contribute more to get to your target.

– If you opt for a high risk portfolio then you will need to be clear upfront that your portfolio is going to fluctuate in value quite considerably throughout the life of your investment and there is no guarantee of the final return.

Finally to sum up the message here and to give the clearest illustration of how you can get a model to tell you what you want to hear I have compiled the best and worst case outputs.

Best case – The Product Floggers model

Inflation at 6% and investment returns at 15.5%

A product flogger wants to sell more product and can make the goal easier to achieve and therefore more attractive to potential buyers by using the best case scenario assumptions.  It is not illegal, it may perhaps not even be considered strictly unethical BUT it is most certainly not going to help their clients to actually reach their goals.

Worst case – The Haters model

Inflation is 11% and investment returns are 7%

There are haters out there of course. Those that have previously had bad experiences in the investment market or perhaps have been sold a product floggers model before and feel somewhat aggrieved by the fact that it was doomed to fail from the start. They want to prove that planning and investing is for the birds and so they use the worst combination of inflation and investment returns to make their case.

The truth is the actual outcome will fall somewhere in between the best and worst case. The exact degree is unknown and unforecastable hence the need for assumptions. Financial targeting is necessary but one needs to monitor and know how to adjust the solution if the assumptions prove wayward.

1As discussed in previous write ups, one can make a strong case for arguing that cash is a high risk investment option over the long-term in that it very rarely maintains your purchasing power.   
2Taxation will in reality also serve to reduce the real returns that you achieve on your investments but I have not included this discussion here as it get’s a little more complicated and long winded while the message remains the same. We need to understand what the real returns are after fee’s, taxation and all other costs.

Read More

Let’s change the ending…

You may not have the power to change where you are but you can change where you are going.